2023/24
Parramatta

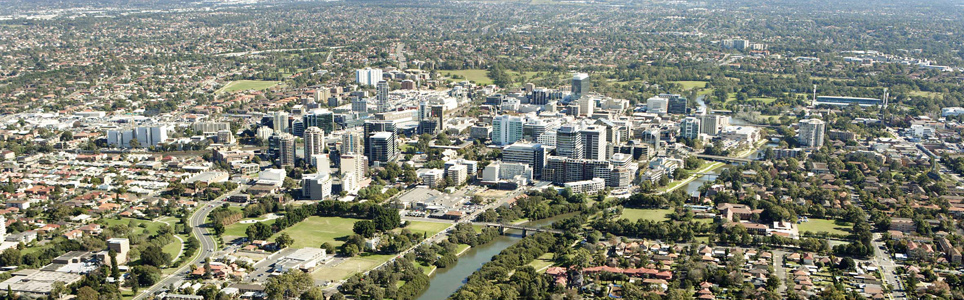
Parramatta City at the head of the Parramatta River and contains many significant heritage buildings and landmarks. The City boasts a vibrant, cosmopolitan community and cultural scene.

The City continues to experience major infrastructure investment, expecting, over the next five years, more than $10 billion will be invested across transport, education, health, sport and culture

Data for this website has been sourced from Council’s financial statements, Council’s annual report and Council’s data returns. The website also refers to data from a number of agencies and entities. Please refer to the data page of this website for links to definitions, information on performance measures, benchmarks, OLG Groups and the data sources that have been used.

Please contact Council if you would like any further details or explanations regarding individual results and any differences between your Council’s performance and that of another council.

Contacting Council

Address:
126 Church Street
Parramatta NSW 2150
Postal Address:
PO Box 32, Parramatta NSW 2124
Phone: 02 9806 5050
Fax: 02 9806 5917

Your Local Government Area

Result
Population (No.) 274,956
Area (Km2) 83.8
Council Classification Metropolitan
OLG Group 3
State Planning Region Metropolitan Sydney

Your Council

Result Group Avg. *
Councillors (No.) 15 13
Population per Councillor (No.) 18330 14575
Equivalent Full Time Staff (EFT) (No.) 1,209 804
2023/24 Revenue ($'000) 471826 295442
2023/24 Expenses ($'000) 383613 247506
Residential Pensioner Rebates (%) 7.859024902 10.17760603
Population Density (residents per Km2) 3,281 3,440.93
* A NSW council group is determined firstly by whether they are Urban or Rural in nature, and then by population size and density. Please refer to OLG Groups in data tab on website for more information on how individual councils are classified. An OLG group average is then calculated by the average of the same group number eg. All Group 5 Regional Towns/City or all Group 8 Rural.

Your Public Facilities

Result Group Avg.
Public Swimming Pool Complexes (inc rock pools) (No.) 3 5
Public Halls (No.) 27 23
Public Libraries (No.) 8 5.333333333
Open Public Space (ha) 836.22 1086.230667
Total Road Length (km) 652.60 562.38

Demographics of Population

under 20 years
20 - 59 years
60 years and older

Council population (%)

Group population (%)

4.6%

population change last 5 years

Source: ABS, Estimated Resident Population (ERP)

Your Local Population

Latest Outcome Group Avg.
Five Year Population Change (%) 4.645466316 0.073449879
Population aged under 20 years (%) 22.6 22.62152185
Population aged between 20 and 59 years (%) 57.2 57.17908386
Population aged 60 years and older (%) 20.2 20.19939429
Aboriginal & Torres Strait Islanders (%) 0.9 1.070240399
Speaks language other than English at home (%) 56.4 41.46666667
Socio-Economic Index Rank (1 low, 128 high) 112 102.7222222

Council Population Gender

Aboriginal & Torres
Strait Islander

Language Diversity

Rest of population

Your local population (%)


Your Local Economy

Result Group Avg.
Unemployment Rate (%) 2.5 3.861111111
Avg Taxable Income ($) 84293.5
Avg Household Size (No.) 2.8 2.772222222
Value of DA's determined ($'000) 977631 511978
Active Businesses in LGA (No.) 31050 20876.66667

Largest Industry Employer

Health care / Social