2023/24
Blayney

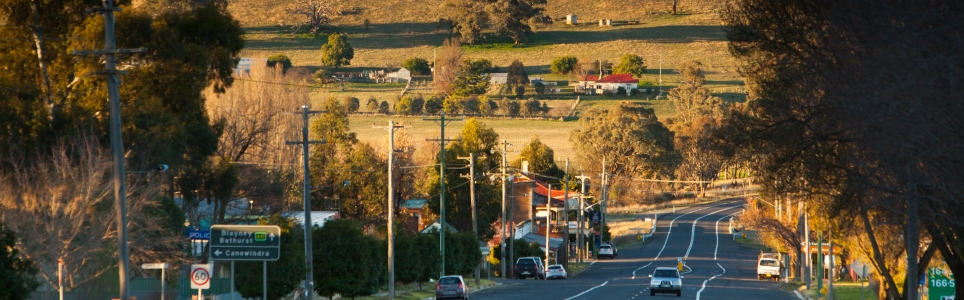
Blayney Shire is located on the Central Tablelands with the green peaks of Mt Canobolas and Mt Macquarie dominating the landscape.

The region boasts rolling hills, bubbling streams and lush pastures. The Shire has a number of historic and picturesque villages.

Data for this website has been sourced from Council’s financial statements, Council’s annual report and Council’s data returns. The website also refers to data from a number of agencies and entities. Please refer to the data page of this website for links to definitions, information on performance measures, benchmarks, OLG Groups and the data sources that have been used.

Please contact Council if you would like any further details or explanations regarding individual results and any differences between your Council’s performance and that of another council.

Contacting Council

Address:
91 Adelaide Street
Blayney NSW 2799
Postal Address:
PO Box 62, Blayney NSW 2799
Phone: 02 6368 2104
Fax: 02 6368 3290

Your Local Government Area

Result
Population (No.) 7,767
Area (Km2) 1524.6
Council Classification Large Rural
OLG Group 10
State Planning Region Central West and Orana
JO Region Central NSW

Your Council

Result Group Avg. *
Councillors (No.) 7 9
Population per Councillor (No.) 1110 855
Equivalent Full Time Staff (EFT) (No.) 86 120
2023/24 Revenue ($'000) 36462 50781
2023/24 Expenses ($'000) 22588 37197
Residential Pensioner Rebates (%) 16.27522329 22.6628294
Population Density (residents per Km2) 5 1.68
* A NSW council group is determined firstly by whether they are Urban or Rural in nature, and then by population size and density. Please refer to OLG Groups in data tab on website for more information on how individual councils are classified. An OLG group average is then calculated by the average of the same group number eg. All Group 5 Regional Towns/City or all Group 8 Rural.

Your Public Facilities

Result Group Avg.
Public Swimming Pool Complexes (inc rock pools) (No.) 1 2
Public Halls (No.) 6 6
Public Libraries (No.) 1 1.608695652
Open Public Space (ha) 37 198.2795652
Total Road Length (km) 737.74 1,733.51

Demographics of Population

under 20 years
20 - 59 years
60 years and older

Council population (%)

Group population (%)

3.6%

population change last 5 years

Source: ABS, Estimated Resident Population (ERP)

Your Local Population

Latest Outcome Group Avg.
Five Year Population Change (%) 3.59127253 -0.924729073
Population aged under 20 years (%) 24.3 24.33698905
Population aged between 20 and 59 years (%) 43 43.04349818
Population aged 60 years and older (%) 32.6 32.61951277
Aboriginal & Torres Strait Islanders (%) 6.8 12.34374739
Speaks language other than English at home (%) 1.6 2.908695652
Socio-Economic Index Rank (1 low, 128 high) 73 39.82608696

Council Population Gender

Aboriginal & Torres
Strait Islander

Language Diversity

Rest of population

Your local population (%)


Your Local Economy

Result Group Avg.
Unemployment Rate (%) 1.1 2.856521739
Avg Taxable Income ($) 59159 45141.69565
Avg Household Size (No.) 2.5 2.352173913
Value of DA's determined ($'000) 23664 24509
Active Businesses in LGA (No.) 855 926.3043478

Largest Industry Employer

Health care / Social